Every perspective workspace is composed of three main sections all of which are all used utilized in our RCP applications:
- top menu bar
- content area (perspective)
- bottom status/info bar
Menu Bar

The left section of the top menu bar has three buttons for selecting different perspectives. The Dashboard is the one that should be used by observers. The Developer perspective requires a login. The Custom/Personal perspective is a place holder for power users to fully customize a perspective to their own requirements. This perspective is not very practical right now because all astronomers use the same account and there is no way to persist a chosen configuration. There are plans for individual institutional accounts which would allow such customizations in the future.
...
- Get Temp - Starts the temperature logging loop which is usually the last thing the observer does before ending the observing session
- Exit LOIS - As the name implies, sends a message to LOIS to exit.
- Initialize LOIS - Sends the initialization command to LOIS after it has been started. There is currently no way to start LOIS remotely from the UI.
- Test Broker - A message to the ActiveMQ message broker to check and see whether there is a communication problem.
- Disable Exposure - ???
- Enable Exposure - ???
- Stop Series/Script - Sends the "nstop -async' command to LOIS which causes a series or script to terminate. This does not cause an exposure abort.
Status/Info Bar

This is the place where the status of some important outside systems are displayed:
...
All of the above labels have tooltips which will activate by cursor hover.
Content Area
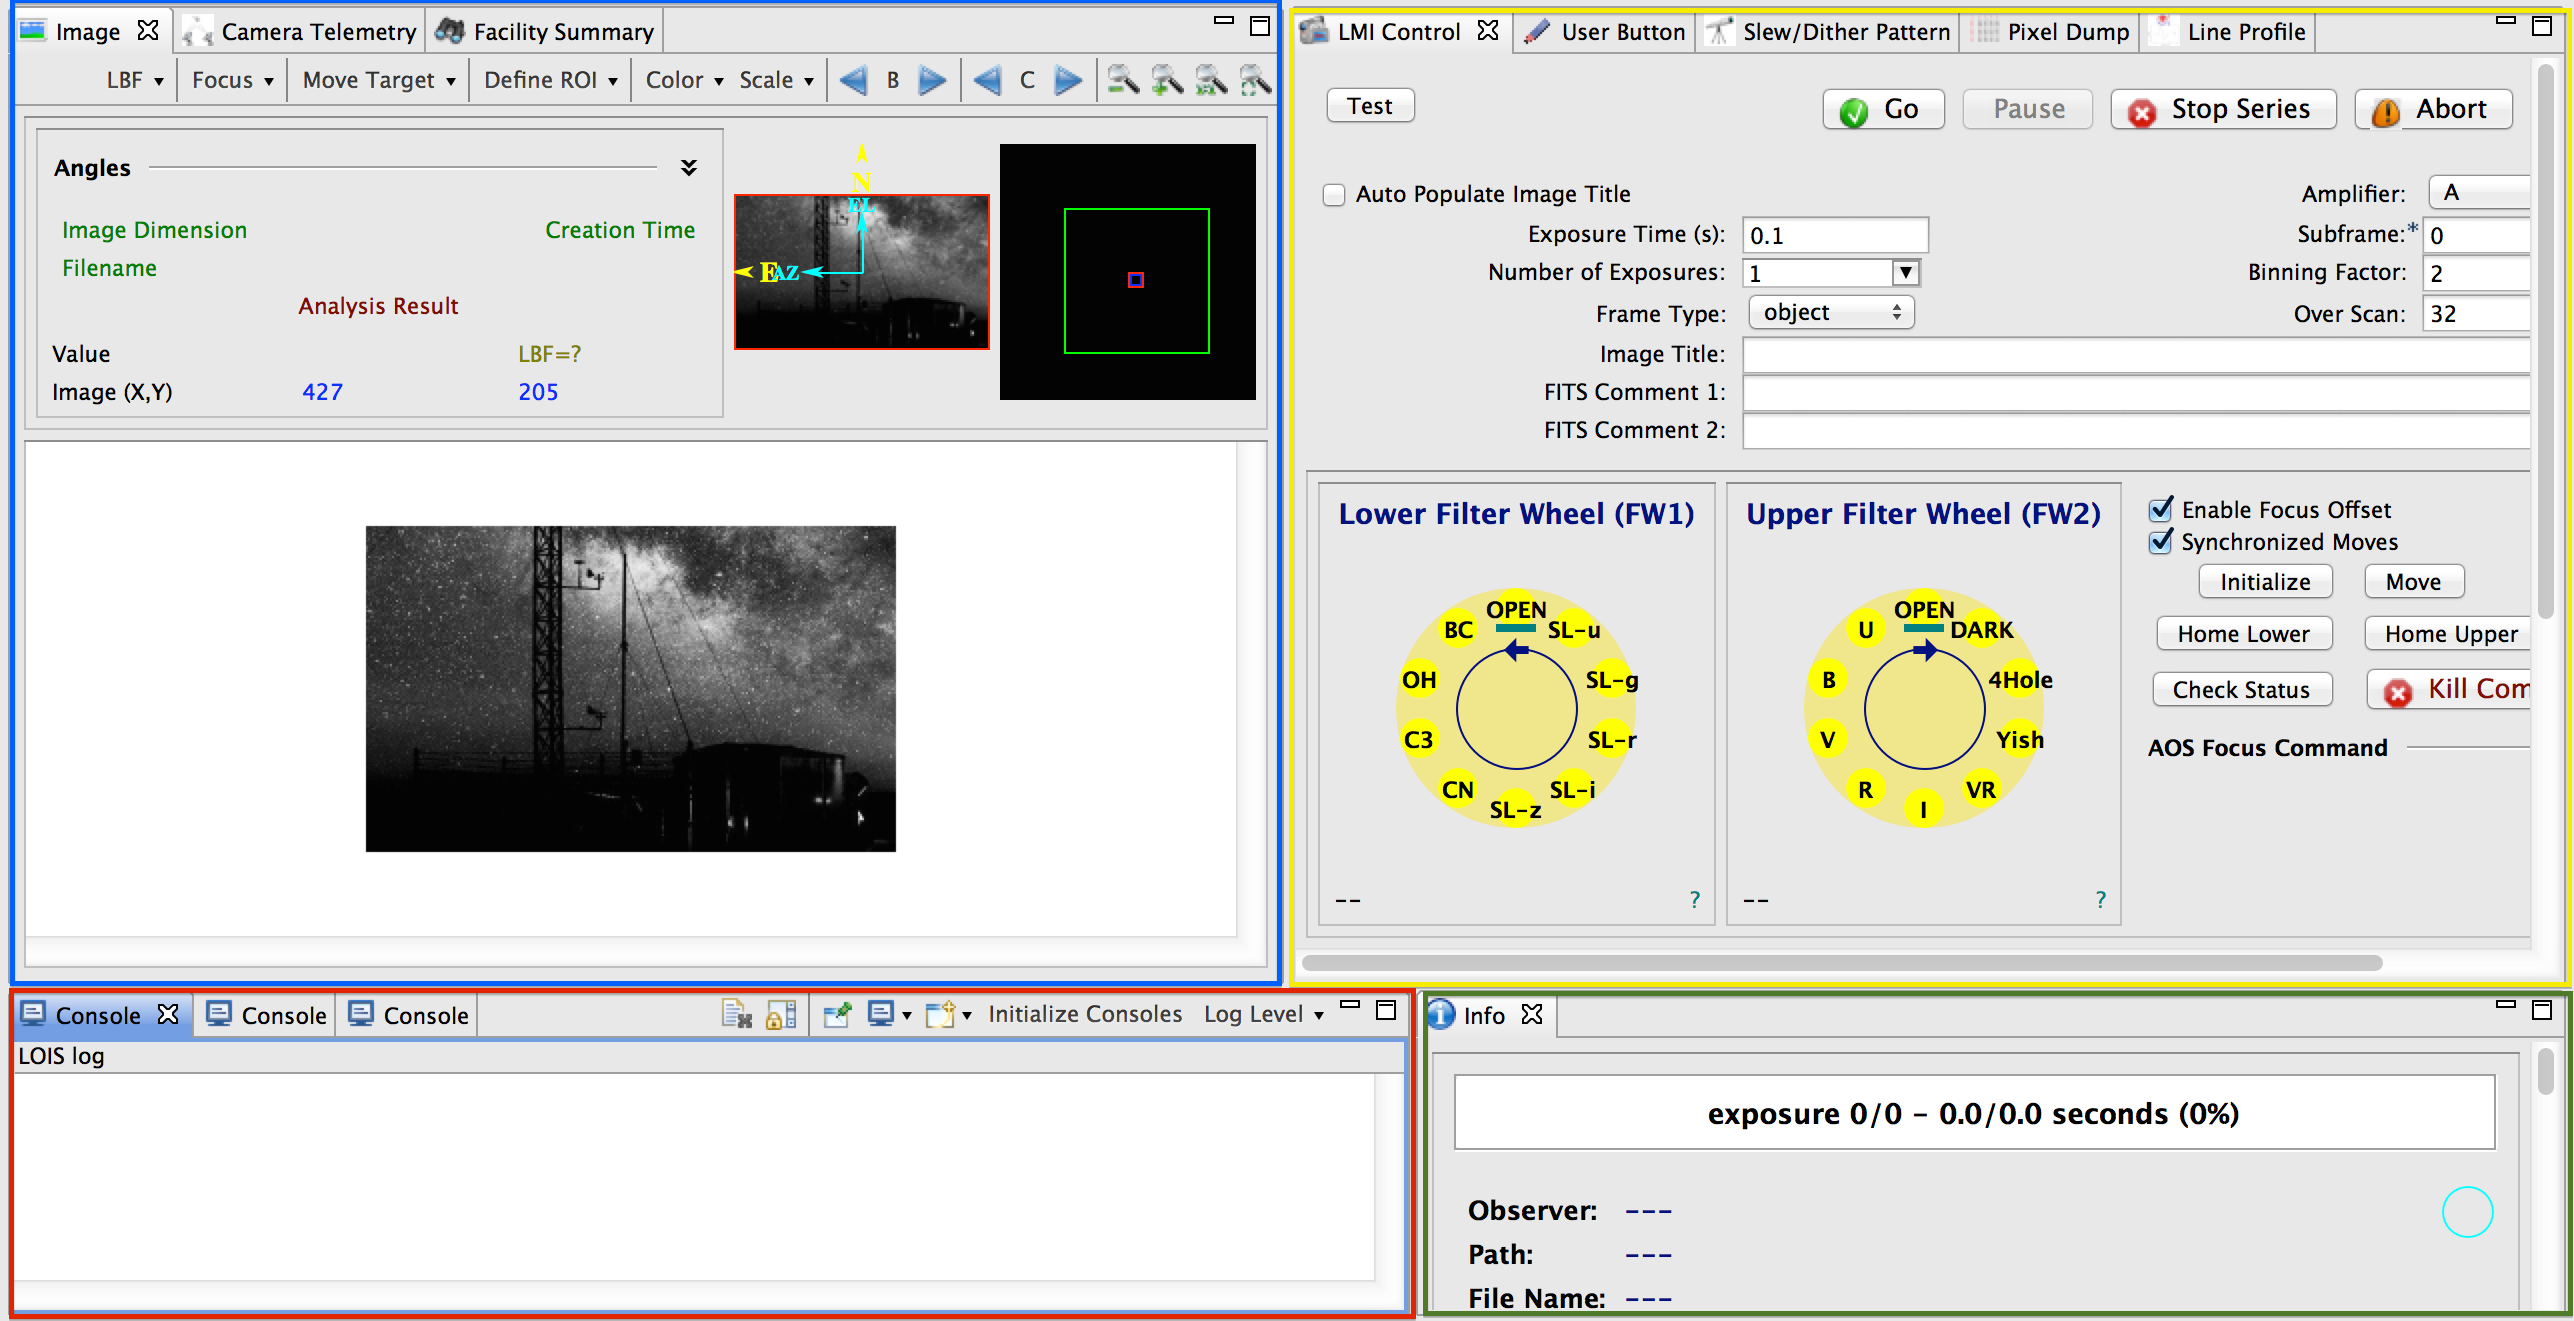
The content area is the placeholder for the views and has a flexible grid pattern. For the dashboard, We have created 4 panes and the views are organized within these panes as separate tabs. The panes are:
Dashboard - Upper Left Pane contains the imager, camera telemetry and Facility Summary views.
Dashboard - Upper Right Pane contains LMI Camera Control, User Buttons, Automated Functions, Pixel Dump and Line Profile views
Dashboard - Console Pane contains consoles which display LOIS log, LOIS commands, and LOIS telemetry in raw XML
Dashboard - Info Pane contains the Info view
Please refer to the description of the different panes for more details. The layout and composition of the content area is what a perspective is designed to do.